이호경자료
ElasticSearch
startup
bin/elasticsearch -d 에러 시
# Exception in thread "main" java.lang.RuntimeException: don't run elasticsearch as root.
      at org.elasticsearch.bootstrap.Bootstrap.initializeNatives(Bootstrap.java:93)
      at org.elasticsearch.bootstrap.Bootstrap.setup(Bootstrap.java:144)
      at org.elasticsearch.bootstrap.Bootstrap.init(Bootstrap.java:270)
      at org.elasticsearch.bootstrap.Elasticsearch.main(Elasticsearch.java:35)
Refer to the log for complete error details.
.bash_profile alias 설정
#alias elasticsearch_run="~/local/elasticsearch/bin/elasticsearch -d"
alias start_es="cd ~/local/elasticsearch; bin/elasticsearch -d -p es.pid"
#echo 'kill `cat es.pid`' > stop.sh
alias stop_es="cd ~/local/elasticsearch; ./stop.sh"

alias start_kibana="cd ~/local/kibana/logs; nohup ~/local/kibana/bin/kibana &"
#alias start_logstash="cd ~/local/logstash/logs; nohup ~/local/logstash/bin/logstash -f ~/local/logstash/conf/nginx.conf &"
alias start_logstash="cd ~/local/logstash/logs; nohup ~/local/logstash/bin/logstash -f ~/local/logstash/conf/status.conf &"

alias log_es="tail -f ~/local/elasticsearch/logs/elasticsearch.log"
alias log_kibana="tail -f ~/local/kibana/logs/nohup.out"
alias log_logstash="tail -f ~/local/logstash/logs/nohup.out"

alias ps_es="ps -ef | grep elasticsearch"
alias ps_kibana="ps -ef | grep kibana"
alias ps_logstash="ps -ef | grep logstash"
Plugin
- 플러그인을 통해 쉽게 기능을 확장
- 버전 업데이트가 되면서 플러그인 명령이 약간 수정된 듯 함.
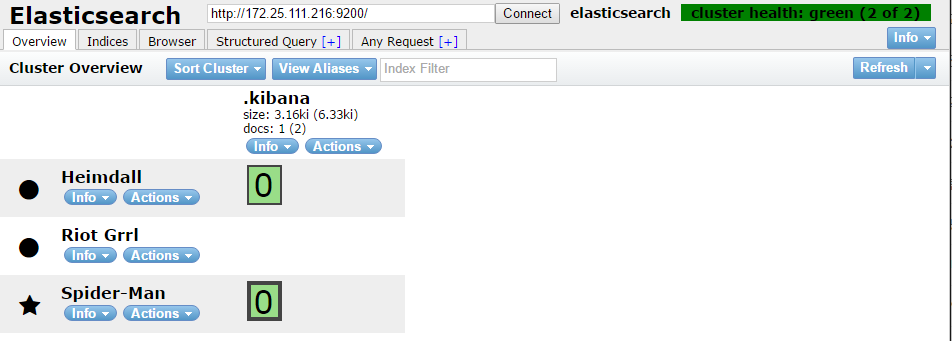
Head Plugin
- 인덱스와 샤드, 도큐먼트에 대한 관리, 상태를 점검
기본적인 검색 질의 기능 제공
탭 구분 안내
- Overview : 기본적인 노드 목록과 노드에 생성된 인덱스 목록을 자세하게 보여주며, 인덱스의 메타 정보와 관리를 위한 기본 액션을 포함
- Brower : 생성된 모든 인덱스 목록과 필드 그리고 저장된 데이터 목록을 보여줌.
- Structured Query : bool 쿼리 형태로 질의 가능한 웹 화면 제공
- Any Request : JSON 형태의 쿼리를 생성하여 질의할 수 있는 기능 제공
설치 후 화면
# head plugin
# https://mobz.github.io/elasticsearch-head/
elasticsearch/bin/plugin -install mobz/elasticsearch-head
http://localhost:9200/_plugin/head/

# 실제 설치
$ bin/plugin -h
NAME
    plugin - Manages plugins
SYNOPSIS
    plugin <command>
DESCRIPTION
    Manage plugins
COMMANDS
    install    Install a plugin
    remove     Remove a plugin
    list       List installed plugins
NOTES
    [*] For usage help on specific commands please type "plugin <command> -h"

$ bin/plugin install mobz/elasticsearch-head
-> Installing mobz/elasticsearch-head...
Trying https://github.com/mobz/elasticsearch-head/archive/master.zip ...
Downloading ...........DONE
Verifying https://github.com/mobz/elasticsearch-head/archive/master.zip checksums if available ...
NOTE: Unable to verify checksum for downloaded plugin (unable to find .sha1 or .md5 file to verify)
Installed head into /home/hklee/local/elasticsearch/plugins/head
ElasticHQ
- head plugin보다 깔끔한 UI에 Head보다 좀더 자세한 정보들을 보여주는 플러그인
- github 주소
$ bin/plugin install royrusso/elasticsearch-HQ
-> Installing royrusso/elasticsearch-HQ...
Trying https://github.com/royrusso/elasticsearch-HQ/archive/master.zip ...
Downloading ....................................DONE
Verifying https://github.com/royrusso/elasticsearch-HQ/archive/master.zip checksums if available ...
NOTE: Unable to verify checksum for downloaded plugin (unable to find .sha1 or .md5 file to verify)
Installed hq into /home/hklee/local/elasticsearch/plugins/hq

# 설치 후 브라우저에서 http://ip:port/_plugin/hq 로 접속
Elasticsearch-SQL
- ES내에 있는 JSON Document를 SQL로 검색 할 수 있는 플러그인
- github 주소
$ bin/plugin install https://github.com/NLPchina/elasticsearch-sql/releases/download/2.3.3.0/elasticsearch-sql-2.3.3.0.zip
-> Installing from https://github.com/NLPchina/elasticsearch-sql/releases/download/2.3.3.0/elasticsearch-sql-2.3.3.0.zip...
Trying https://github.com/NLPchina/elasticsearch-sql/releases/download/2.3.3.0/elasticsearch-sql-2.3.3.0.zip ...
Downloading ..............................DONE
Verifying https://github.com/NLPchina/elasticsearch-sql/releases/download/2.3.3.0/elasticsearch-sql-2.3.3.0.zip checksums if available ...
NOTE: Unable to verify checksum for downloaded plugin (unable to find .sha1 or .md5 file to verify)
Installed sql into /home/hklee/local/elasticsearch/plugins/sql

# 설치 후 브라우저에서 http://ip:port/_plugin/sql 로 접속
테스트
데이터 입력
- 데이터 입력 후 확인
$ curl -XPUT http://localhost:9200/test/log/1 -d '{
"title":"test-log-01",
"content":"test-log-01....",
"createDt":"2016.06.09T09:15:55"
}'
{"_index":"test","_type":"log","_id":"1","_version":3,"_shards":{"total":2,"successful":2,"failed":0},"created":false}

검색
curl -XGET 'http://localhost:9200/test/_search?q=title:test-log-01'
- Head Plugin에서는 하이픈(-)은 검색이 안됨
- '_'는 검색이 됨
서버 모니터링
logstash config
input {
  #linux shell 명령어로 메모리 사용량 체크
  #5초마다 command 실행
  exec {
    command => "free | grep Mem | awk '{print int($3/($3+$4)*100)}'"
    interval => "5"
    type => "mem"
  }
  #cpu 사용량 체크
  exec {
    command => "cat /proc/stat | grep cpu | awk '{print int(($2+$4)/($2+$4+$5)*100)}'"
    interval => "5"
    type => "cpu"
  }
}
filter {
  mutate {
    convert => ["message", "integer"]
  }
}
output {
  #elasticsearch 연동
  elasticsearch{
        hosts => "elasticsearch아이피:포트"
        index => "server-status-%{+YYYY.MM.dd}"
  }
  stdout{}
}
elasitcsearch 데이터 확인

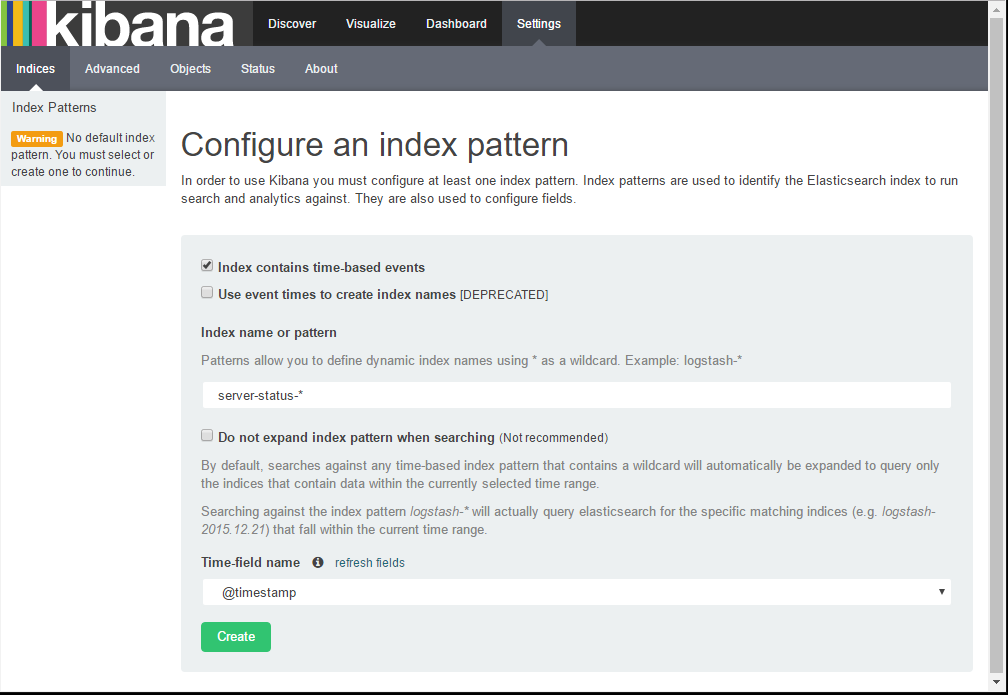
kibana 연동
- settings
- 아래 이미지와 같이 logstash에서 설정한 elasticsearch.index pattern 등록
- Discover 설정
- 아래 이미지와 같이 나와야 정상
- 데이터 출력이 안될 경우 서버 시각 설정 : linux의 경우 ntp

- Visualize 설정
- 만들고자 하는 char 클릭 후 설정
- 저장된 Discover가 없을 경우 신규로 생성하면서 진행
- 'type:mem'으로 필터링
- Y축은 'Median'으로 선택 후 Field는 메모리 사용량 컬럼인 'message' 선택
- X축은 시간순으로 표시하기 위해 'Date Histogram' 선택 후 Field는 '@timestamp' 선택
- 위와 같이 설정 후 저장. 저장된 Visualize는 Dashboard에서 사용 가능함.

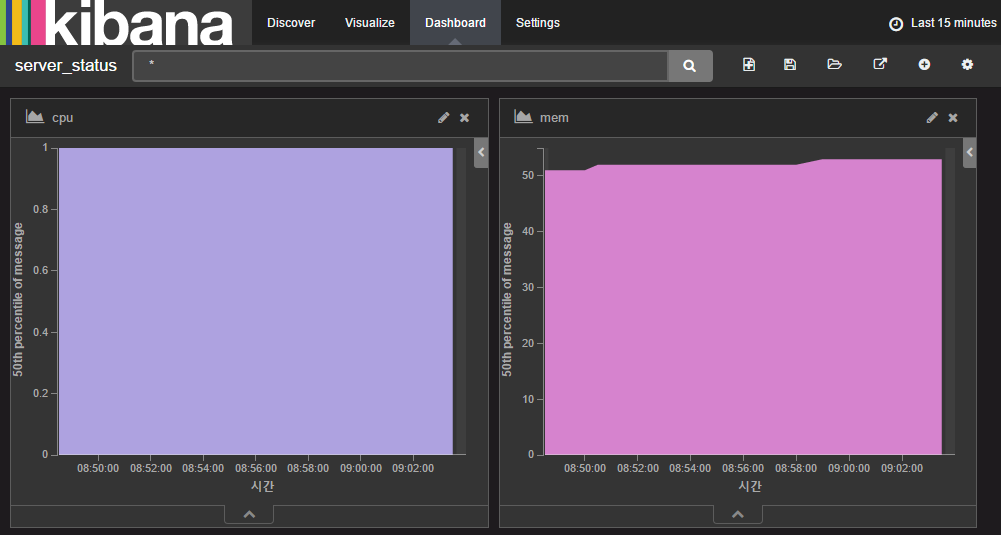
- Dashboard 설정
- 앞서 저장한 Visualize를 재활용
참고
-
- 기본적인 설치 및 관련 링크 좋음
-
- elasticsearch로 로그 검색 시스템 만들기
-
- 한글 형태소 분석기 및 Marvel Plugin 설명
ELKR (ElasticSearch + Logstash + Kibana + Redis) 를 이용한 로그분석 환경 구축하기
- ELK + Redis 를 사용하여 간단한 예제 설명
-
- 멜론 ES 아키텍쳐 소개 자료 : DeeepDetect와 ElasticSearch를 활용하여 자동 태깅한 사례를 소개
- 추후 DD 도 해볼만 할 듯
-
- 추후 사용 가능할 듯